High Performance Supply Chains (Part 2)
In the earlier blog we created an overview of challenges and pitfalls many companies experience when they attempt to improve the management and performance of their Supply Chains.
Macro Level Gap Analysis
In many cases improvement strategies are not created to address specific under performing aspects within the Supply Chain that may be identified with current KPI reporting. An initial review at the macro level can provide an indication of where opportunities exist for a Supply Chain win.
Agreed upon metrics: Customer Service and P&L results as Enterprise Goals
I know, this sounds odd, but many companies don’t necessarily align their metrics and the DITL “Day in the life” activities of their associates to their business model. Recent experiences with a typical low margin Electronics retailer is a good example. All agreed “aged inventory” was an issue. However, this company did not have agreed upon aged inventory definitions, reporting or reviews as part of their associates DITL. Thus, agreed upon, reporting had not been created. When reporting was created an initial review indicated 25% of the current active inventory was significantly aged, with the majority of the inventory in the shorter life cycle categories! Regardless of definitions, this was clearly an issue.
The creation, distribution and subsequent healthy discussions regarding these reporting results created a new reality relative to aged inventory. New review processes and timelines were created and within 1 year our report revealed less than 2% of inventory was now defined as aged. Weekly reviews were now in place and with agreed upon definitions there were no disputes, just action.
Get a Win!
The quality of the inventory, turns, in stock positions and cash flow improved dramatically. The introduction of the reporting moved the aged/quality of inventory issue into the “Day in the Life” of the key business associates and the results continued to improve going forward. The key business associates embraced this metric and the age of the company’s inventory was now a DITL activity.
This achievement was a significant “win” for the new Supply Chain Department. It aligned the organizations DITL processes to Supply Chain related metrics, clearly showing the association between agreed upon metrics, corporate action on same, the customer experience and the P&L.
This win provided the new Supply Chain Department an opportunity to introduce other key metrics as a DITL requirement across the various business units. The results were immediate and significant. We were now tracking our home delivery lead times that were improving dramatically MOM and YOY. These Home Delivery Lead Time improvements were credited with significant sales increases across the category. These over budget sales increases in this higher margin category had another very positive impact to the corporate P&L.
I have provided an example of this type of “user friendly, intuitive” reporting described above. In the following reporting example you can see the “30 day buckets” of inventory expressed as a percent of the total inventory. The margin and supplier average payment terms information introduces corporate cash flow into the associates “Day in the Life” activities. I think we all have experienced or are experiencing situations where we spend significant amounts of time planning, creating, presenting and signing off on our operating budgets and then struggle trying to determine where we are compared to plan. This summary is designed to provide us that information at a glance and at whatever frequency we feel is required.
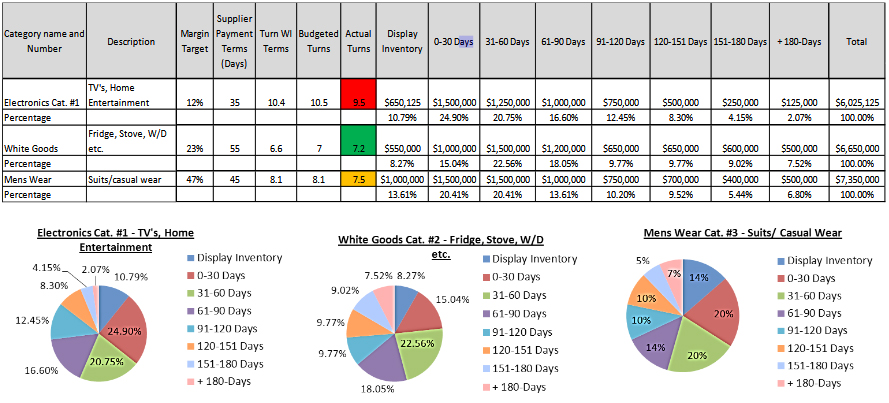
I have found that this type of summary allows for action to be taken to address “potential” issues as opposed to actual problems. You can see in the reporting that the Electronics Category is trending behind in YTD turns. This area has the shortest life cycle product and has the highest potential risk of causing corporate mark downs if the inventory is allowed to age beyond the plan.
The two key elements in a successful application on any Supply Chain Initiative are User Friendly and Intuitive reporting aligned with agreed upon metrics, and remember always keep it simple.